
Your data has a story to tell
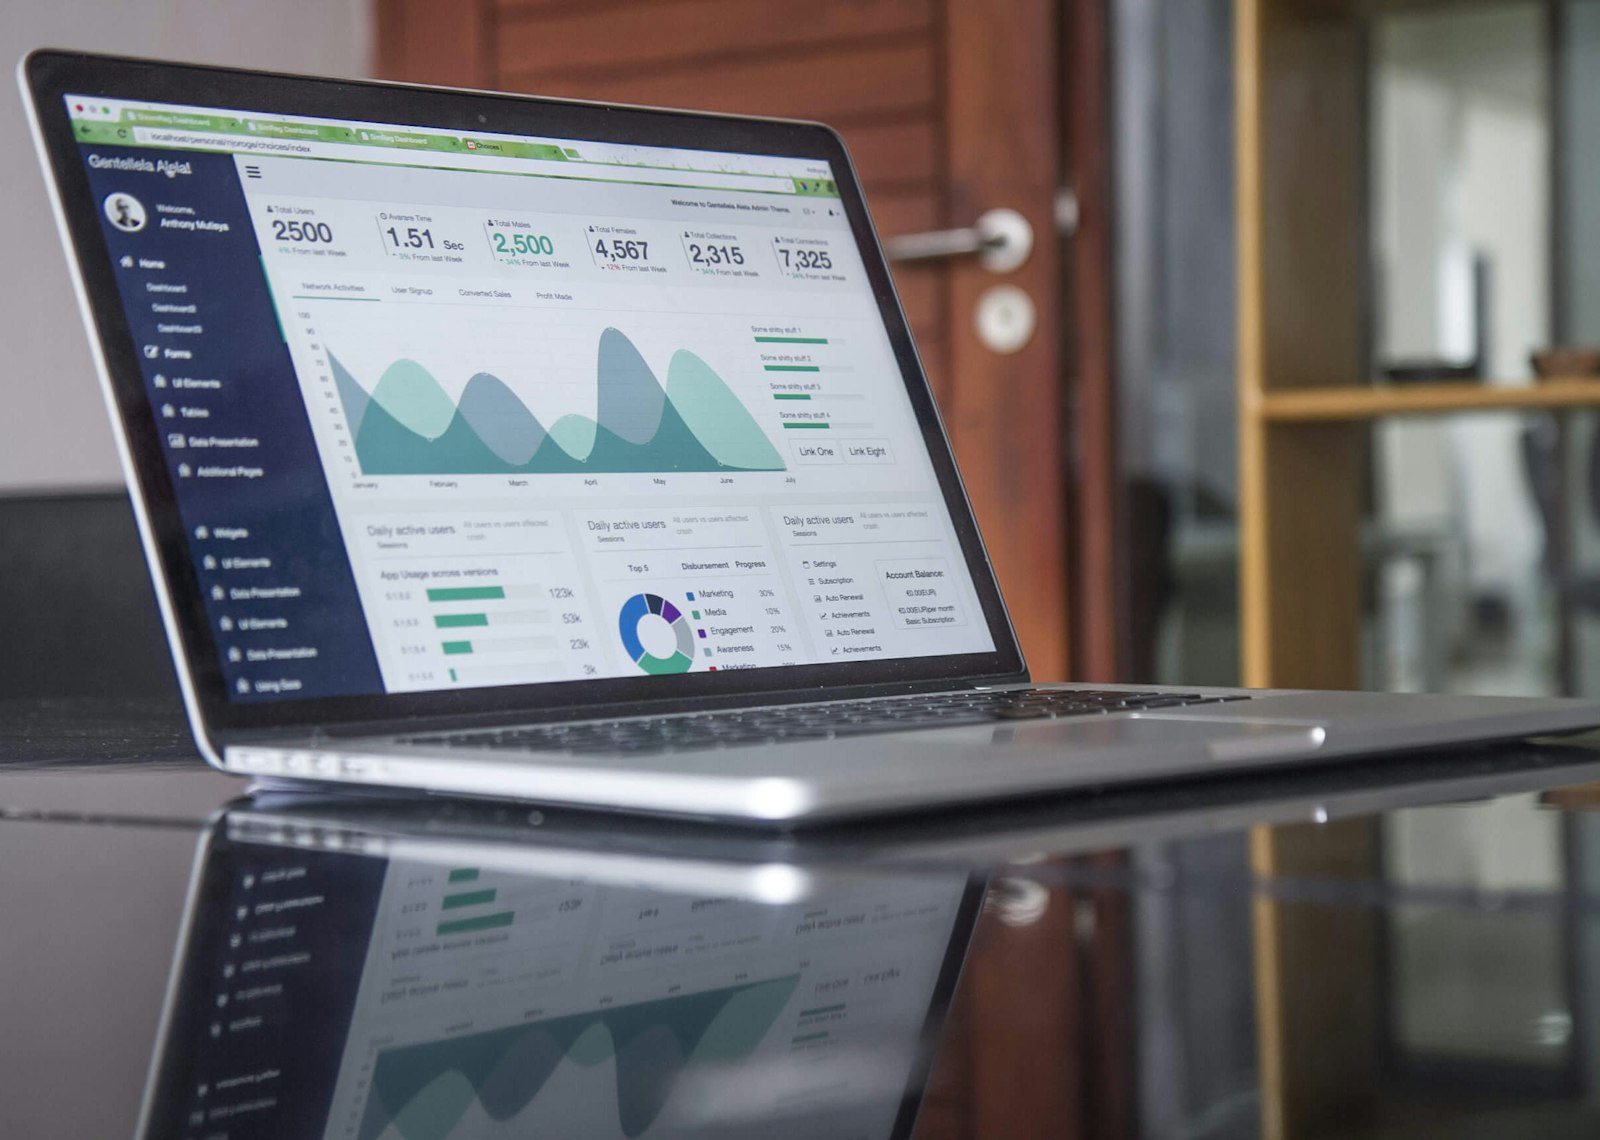
We have seen how Big Data is a powerful tool for discovering valuable insights. But without a framework to understand the conclusions, all that information stays hidden. Human beings are wired to understand visuals better: that is why traffic signs are icons, not paragraphs. Analyzing petabytes is useless if we then fail to communicate the conclusions in a way that is comprehensible, easy and fast. That is where dashboards come in.
Why visualization matters
A spreadsheet with thousands of rows is opaque. A dashboard with bar, line and pie charts turns that noise into decisions. Visualization reveals patterns, outliers and trends that a table would never show at a glance.
Principles of a good dashboard
- Start with the question: what decision should the dashboard enable? Do not fill it with charts.
- KPIs, not vanity metrics: every indicator must drive an action.
- Visual hierarchy: what matters goes top and left; context goes below.
- Real refresh: a weekly panel of yesterday’s data beats a live one of dirty data.
- Self-service: let the business owner explore without relying on IT for every question.
Dashboards: from data to impact
A well-designed dashboard shortens the distance between data and decision. A supply chain that monitors stockouts on a daily panel reacts sooner; a sales team that sees its funnel live sharpens the conversation. Visualization is not decoration: it is operating speed. And when AI agents start acting on that data, control matters: how to control what your company is already deploying.
| Without visualization | With a dashboard |
|---|---|
| Decisions in the dark | Evidence-based decisions |
| Manual, slow reports | Automatic updates |
| Debating the numbers | Focus on the next step |
At BAOSS we design dashboards the business actually uses, not ones that get lost in a browser tab. We connect your sources and turn data into decisions — the same foundation behind AI productivity.
Want a dashboard that actually gets used? Talk to our consulting team.
Prefer to talk to us directly? Contact the BAOSS team and tell us about your challenge.