
10 real-world examples of Big Data Analytics in 2026
In 2017 we published this very article listing “10 examples of Big Data”. Eight years later, the question is no longer what can be done with data, but how long it takes you to go from data to operational decision. Moreover, at BAOSS we have accompanied more than 40 organisations in 2025-2026 to close that gap. The pattern repeats: fragmented data, models in notebooks that never reach production. Also, data teams saturated and asking for “more engineers” when what they need is agentic architecture and governance from day one. In fact, below we go through the real-world uses of Big Data Analytics in 2026, sector by sector.
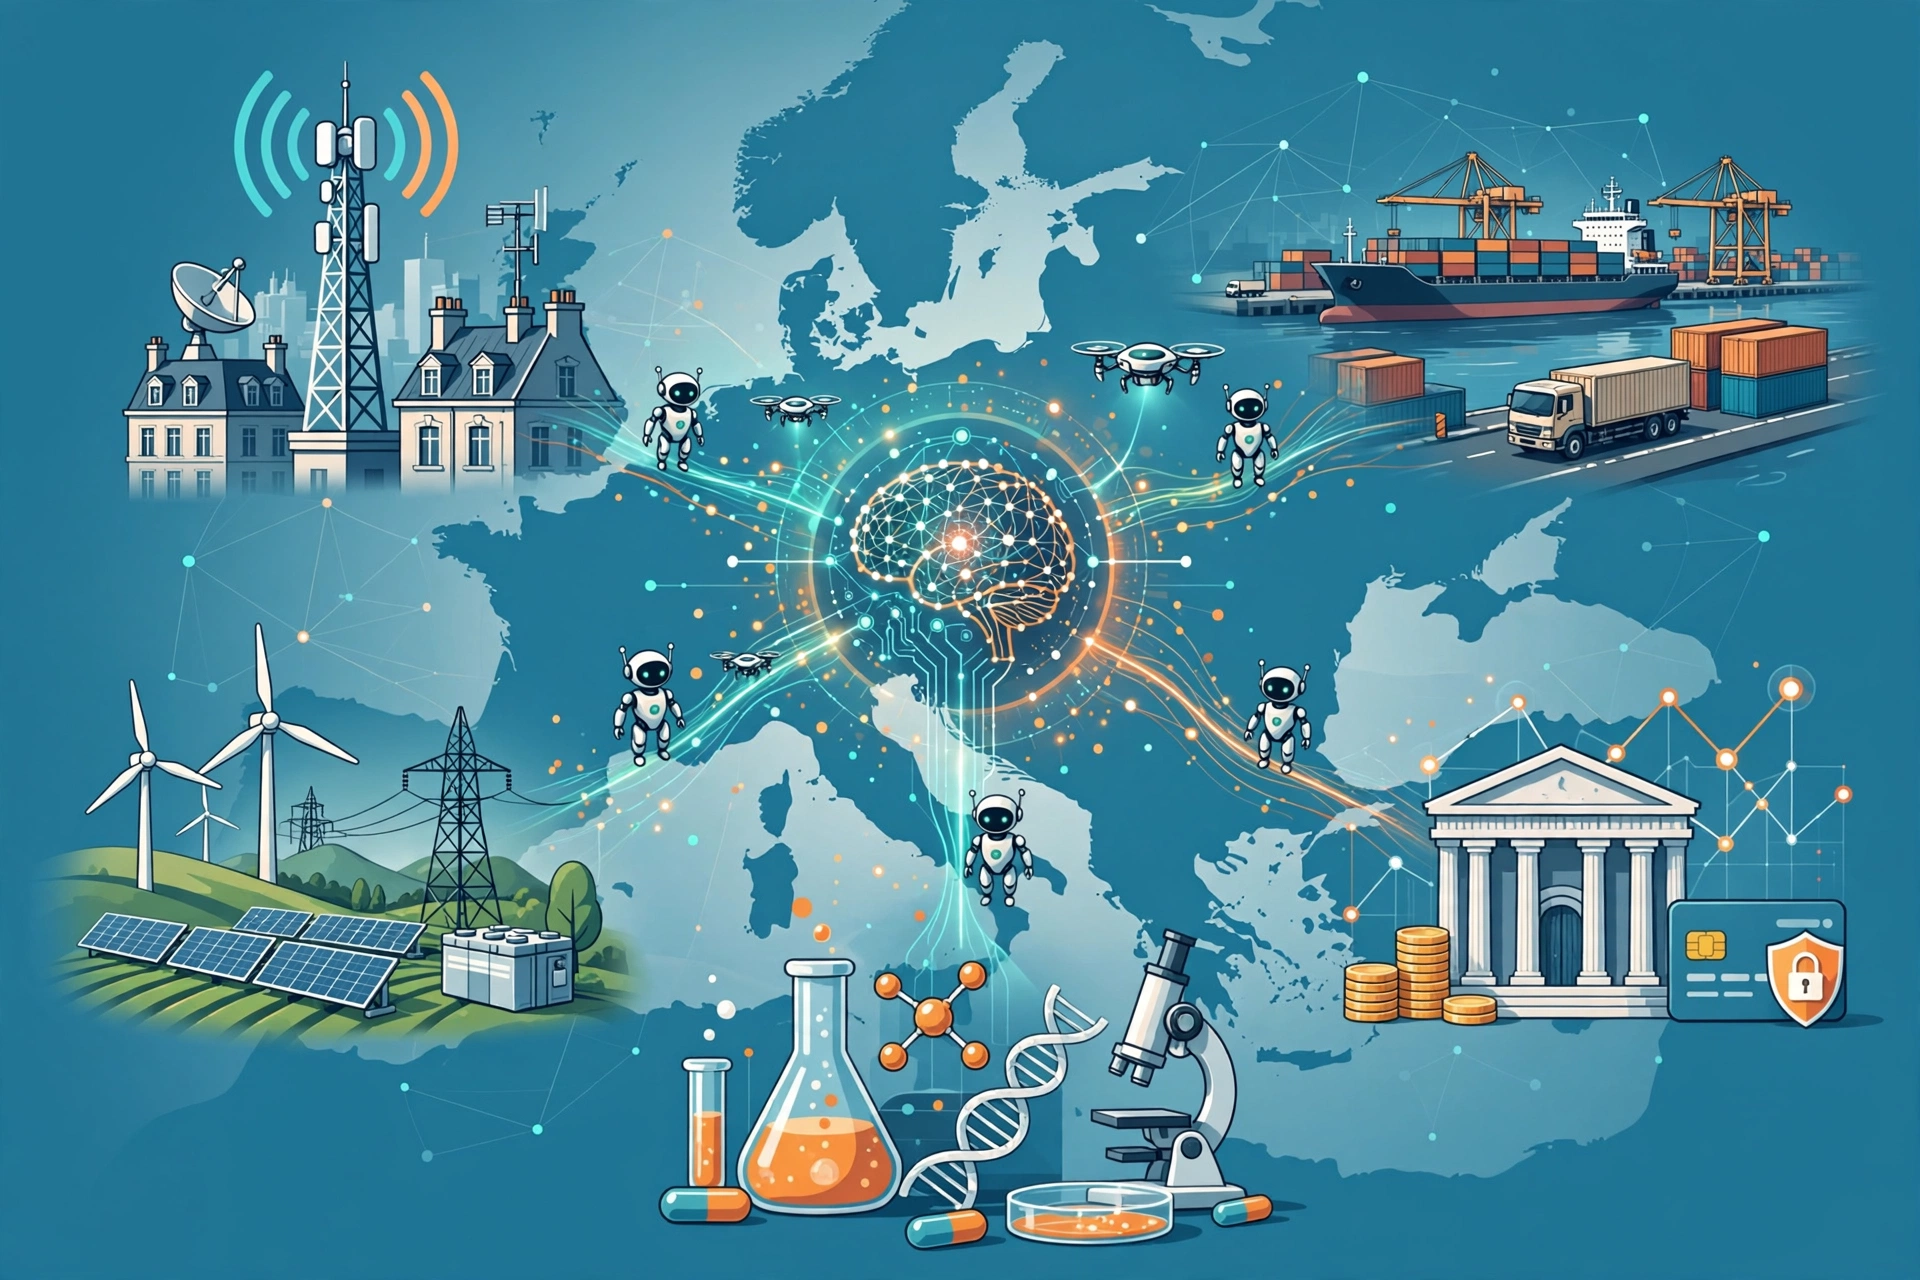
Real-world uses of Big Data Analytics 2026: from “Data Lake” to “Data Product”
Companies that scale analytics in 2026 share three traits. Likewise, they treat every dataset as a product with an SLA and an owner, and they deploy models with native CI/CD for ML (MLOps level 2+). They also use autonomous agents (LangGraph, CrewAI, AutoGen) to orchestrate ingestion, validation, feature engineering and explainability tasks without constant human intervention. Therefore, the “modern” stack is no longer Spark + Airflow + Superset. It is Iceberg/Delta Lake + dbt + vLLM/Ollama (local LLMs) + MCP (Model Context Protocol) + RAG evaluated with RAGAS. Ultimately, if you want to see the next step, we recommend whether your company is exposed to the disruption shock and how to close the productivity gap with AI.
Average result across our clients? Also, a time-to-value of 6-8 weeks versus the 9-12 months of the classic “build a data lake and then see” approach. Below, five real problems solved in 2025-2026 (names and sectors anonymised, metrics audited).
Case 1: Telco — predictive churn + hyper-personalisation with GenAI
Problem: a mobile operator (12M lines) was losing 1.8% of its high-value customers every month. In fact, its batch XGBoost model (trained monthly) detected risk with 72% recall. However, retention campaigns took 3 weeks to launch and used static templates.
BAOSS solution: we migrated to a centralised feature store (Feast + Iceberg) with hourly refresh. Likewise, we deployed a LangGraph agent that: (1) monitors feature drift in real time. (2) automatically retrains if AUC drops > 2pp. (3) generates 1:1 offers with structured GPT-4o (JSON Schema) conditioned on history, current plan, data usage and call-centre sentiment (transcribed with Whisper v3). Therefore, the offer travels via API to the CRM in under 5 minutes.
- Churn recall: 72% → 89% (3-month holdout validation).
- Data→offer time: 21 days → 4 minutes.
- Retained ARPU: +14% versus the control group.
- LLM inference cost: €0.0018/offer (vLLM on a shared A100 GPU, dynamic batching).
Key lesson: the predictive model is a commodity. Ultimately, the differentiator is the closed data→decision→feedback loop with prompt governance (versioning, automatic evaluation with PromptFoo and PII guardrails).
Case 2: Logistics/retail — last-mile optimisation with multi-objective agents
Problem: a fleet of 3,200 vehicles, 1.1M deliveries/month. Moreover, the classic optimiser (OR-Tools, 4h window) could not absorb incidents in real time (traffic, breakdowns, demand spikes). Cost/km 18% above benchmark and 22% of deliveries outside the committed time slot.
BAOSS solution: a CrewAI architecture with 4 specialised agents: Demand Forecaster (LightGBM + exogenous features. In fact, weather, events, macro), Route Planner (HGS-CVRP re-optimising every 15 min), Exception Handler (rewrites routes only for the affected vehicles), Driver Communicator (generates voice/text instructions with Claude 4 Sonnet prioritising safety and SLA). All on Kafka + Flink SQL for telemetry streaming (1.2M events/min).
- Cost/km: -16% (savings of €2.3M/year).
- Deliveries in slot: 78% → 94%.
- Re-optimisations/day: 0 → 3,400 (autonomous, no operator).
- P99 latency event→new route: 8 seconds.
Key lesson: agents do not replace the mathematical optimiser; they wrap around it to make it reactive, explainable and tolerant to dirty data. Likewise, MCP exposes the solver as an invocable tool with a versioned schema.
Case 3: Banking — fraud detection + regulatory explainability (RAG + MCP)
Problem: a mid-size institution (4M customers, 85M tx/month). Therefore, the rules engine + XGBoost generated 12,000 alerts/day; the investigation team (18 analysts) resolved 1,100. False positives at 94%. Moreover, the EBA Guidelines require full traceability of why an operation is blocked.
BAOSS solution: a dual pipeline: (1) streaming scoring (Flink + ONNX Runtime, 12 ms/tx) with behavioural features (tx-sequence embeddings via TabTransformer). Ultimately, (2) an explanatory RAG for each alert. It retrieves the internal policy, the customer’s history and EBA case law, and generates a natural-language report with GPT-4o (strict mode, temperature 0) validated by Guardrails AI. The analyst sees: score, top-5 SHAP features and a narrative ready for the case file. Also, deployment with MLflow + Kubernetes (Argo Rollouts), 5% canary.
- False positives: 94% → 67% (same detection rate).
- In fact, investigable alerts/day/analyst: 61 → 140 (+130%).
- Report time: 18 min → 45 sec (automatic generation + review).
- Audit: 100% of alerts with full traceability (prompt, retrieved context, model version).
Key lesson: RAG is not “chat with PDFs”. Likewise, in production it requires continuous evaluation (RAGAS: faithfulness > 0.92, answer_relevancy > 0.89) and domain-specific semantic chunking. Also MCP so the agent can invoke tools (database queries, risk calculator) without hallucinating.
Case 4: Pharma — clinical trial optimisation with synthetic digital twins
Problem: a phase III oncology trial, 600 patients, 18 countries. Therefore, recruitment was 40% below plan; the cost of each day of delay: €380K. Historical data fragmented across 14 CROs, with heterogeneous formats (EDC, ePRO, wearables, genomics).
BAOSS solution: a federated data mesh (data contracts with OpenLineage, quality with Great Expectations in CI). Ultimately, we trained a survival model (DeepSurv) to predict dropout and response. Innovation: conditional synthetic patients (CTGAN + tabular diffusion) validated by the ethics committee to simulate control arms and reduce the sample size by 15%. Also, an AutoGen agent monitors the recruitment KPIs per day per site and suggests actions (change inclusion criteria, activate backup sites, adjust visits).
- Recruitment time: -22% (4.2 months gained).
- Direct savings: €48M (cost per day × days saved + sample reduction).
- Data quality: 98.7% completeness versus the previous 91% (contracts + automatic validation).
- In fact, updated Probability of Success (POS): +9pp after simulating 10k scenarios.
Key lesson: synthetic data does not replace real patients. However, when well governed (differential privacy ε=0.5, multivariate statistical validation) it speeds up trial design decisions. Likewise, the AutoGen agent acts as a “clinical operations co-pilot”, not as a black box.
Case 5: Energy — hybrid predictive maintenance (physics + ML) in wind farms
Problem: 14 wind farms, 420 turbines (2.1 GW). Therefore, the vibration model (Random Forest) generated 34 alerts/week; 78% were false. Unplanned downtime: 12/year × 4.5 days on average = 54 days/year lost (≈€18M).
BAOSS solution: a lightweight digital twin per turbine (physical equations + parameters calibrated with 10 Hz SCADA history). Ultimately, the physics→ML residual (a multivariate Transformer) detects deviations that physics alone cannot explain. A CrewAI agent prioritises alerts by cross-referencing. Also, asset criticality, the weather window (helicopter/boat access), spare-parts stock and the electricity pool price. It generates the work order in Maximo with parts kit, procedure and safety risk.
- False alarms: 78% → 22%.
- Unplanned downtime: 12 → 3/year (-75%).
- Availability: 96.2% → 98.7% (+2.5pp = +€14M/year in revenue).
- Model cost: €0.04/turbine/day (CPU inference, nightly batch).
Key lesson: the physics-ML hybrid beats “data only” when the physics is known and failures are rare. In fact, the agent turns the prediction into an executable action plan integrating real operational constraints.
Stack 2017 vs 2026: what has died and what scales
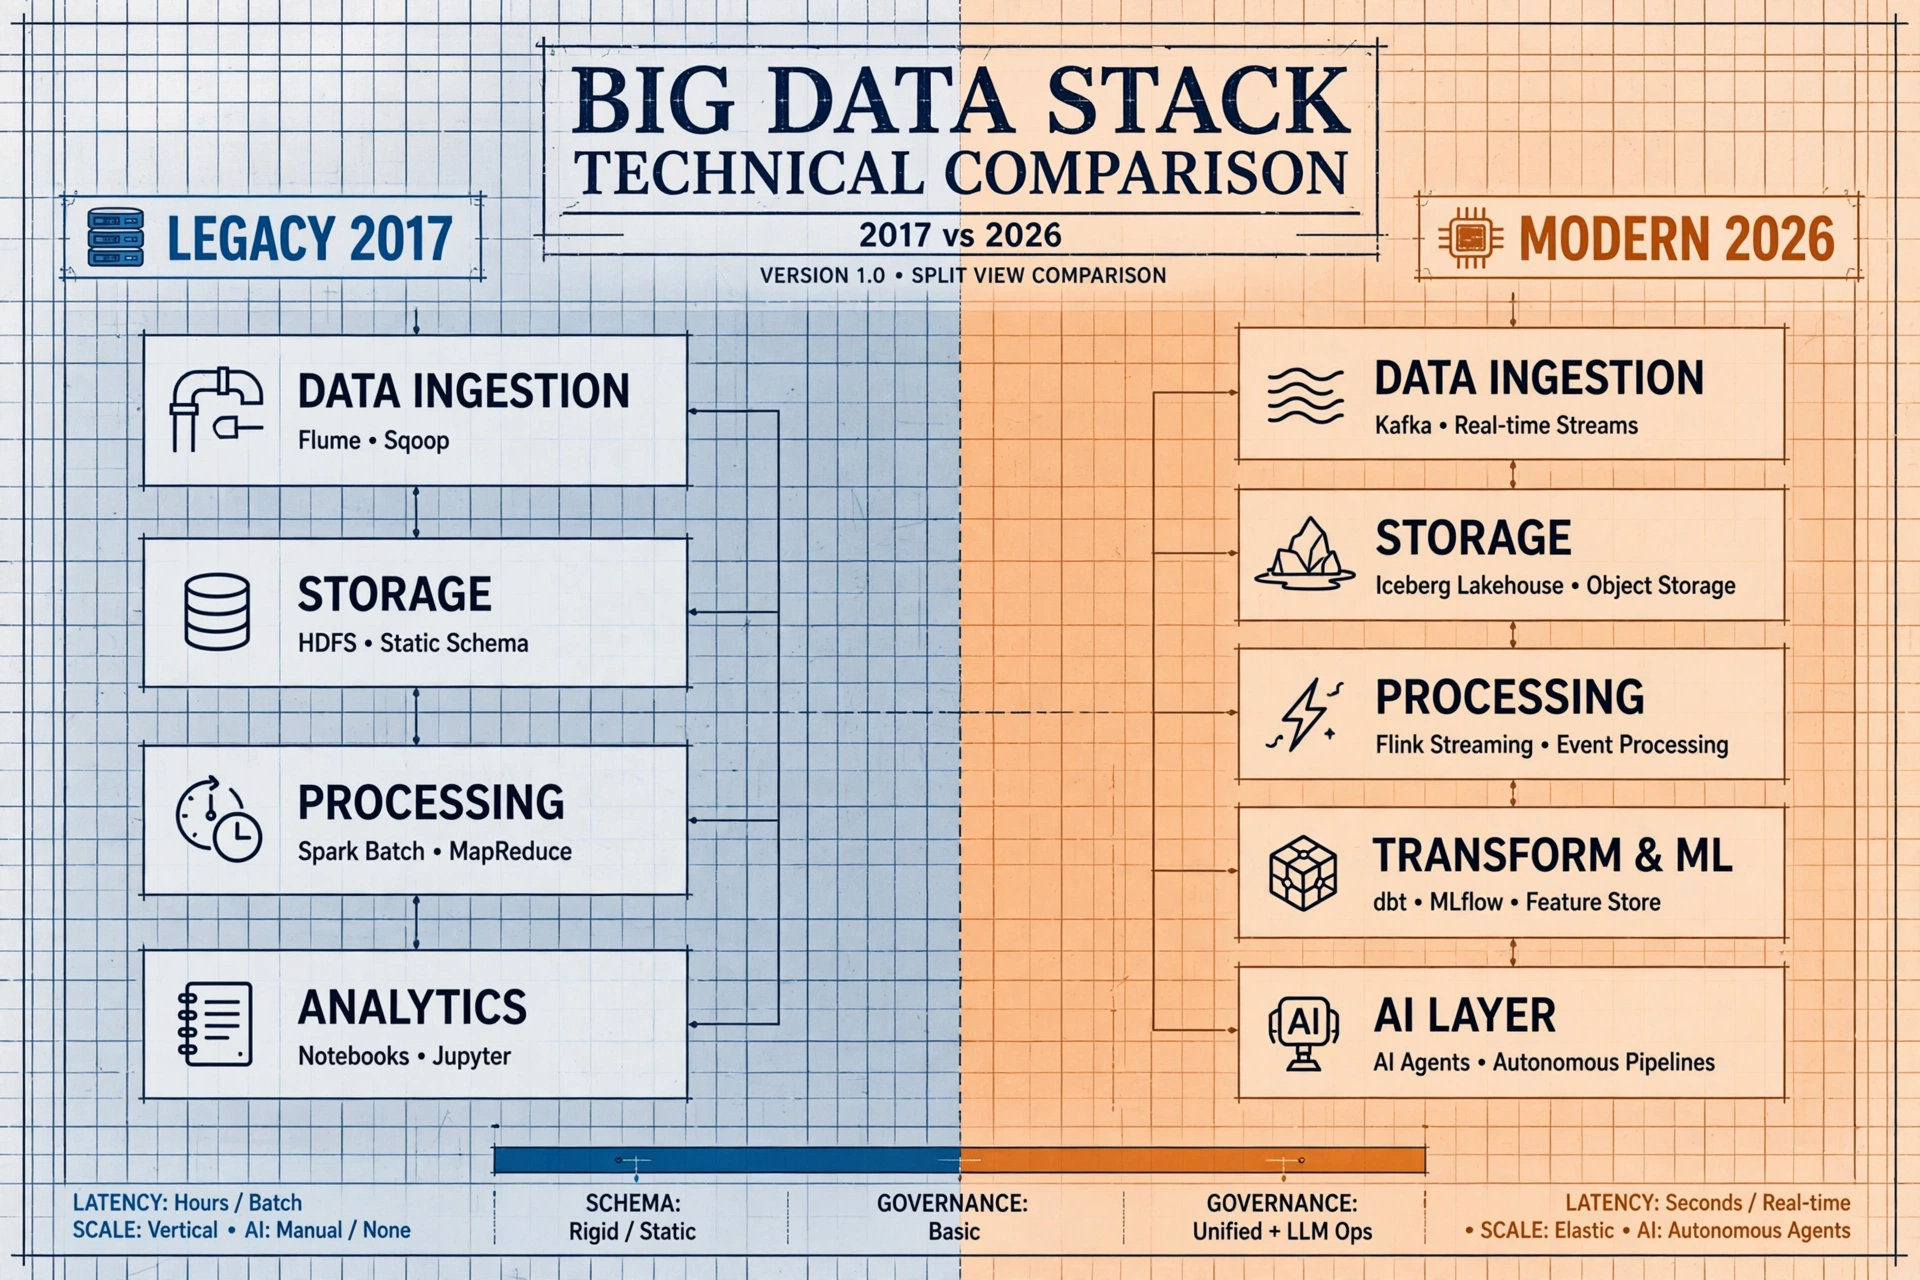
| Layer | 2017 (original article) | 2026 (BAOSS production) |
|---|---|---|
| Storage | Hadoop HDFS, “swamp” data lake | Iceberg/Delta Lake + Unity/OpenLineage catalog |
| Processing | Spark batch, MapReduce | Flink SQL (streaming), dbt (transform), Polars (local) |
| ML/Ops | Notebooks → manual deploy | MLflow + Argo/Kubeflow + canary + automatic drift detection |
| Models | Point models, manual retraining | Feature store (Feast) + automatic retraining + continuous RAGAS evals |
| AI in operations | BI dashboards | Autonomous agents (LangGraph/CrewAI/AutoGen) + MCP + RAG with guardrails |
Conclusion
The ten 2017 cases boiled down to “collect, store and visualise”. Likewise, the 2026 cases are something else: systems that turn data into operational decisions in seconds, with agents that monitor, retrain, explain and act under selective human supervision. Therefore, value no longer lies in having more data, but in the architecture that puts it to work: open lakehouse, feature store, evaluated RAG and agents with governance.
Ultimately, at BAOSS we close that gap with a 6-8 week time-to-value and audited metrics across more than 40 organisations. If your data is still stuck in notebooks and dashboards, what you are missing is not a bigger data lake.
Request your analytics diagnosis and discover how much value is in your data →
Prefer to talk to us directly? Contact the BAOSS team and tell us about your challenge.
Related articles: Steps for Building a Big Data Team.